Awara Global Survey on Total Payroll Taxes 2014
Awara Global Survey on Total Payroll Taxes 2014
2,884 viewsWhat we wanted to find out? – Of all the money that goes towards salaries and wages what portion is actually received in hand by the employee net of taxes and all social security contributions? The specific question we posed was: What is the total pay-roll cost of an employer in order for an employee to get X amount of Euros (US dollars) in hand?
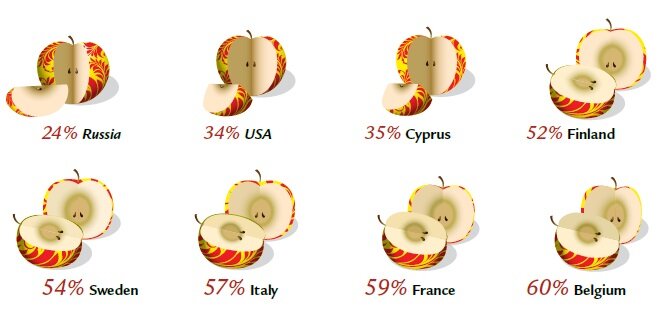
We determined the percentage that is actually received in cash by the employee net of all taxes and statutory payments regardless if the cost is charged from the employer or the employee’s salary. The survey measured what in various countries is the relation between the net take-home pay (net salary after taxes) and the total cost that the employer must carry considering the gross salary and all payroll taxes. Thus the survey tells how much the employer has to pay in order for the employee to receive a certain net salary after all statutory deductions. This can be expressed as the Gross Labor Cost Multiplicator, the factor by which net pay is multiplied to yield the total employer costs. (Figure 1). Conversely the same is expressed as the Net Take-Home Percentage, the percentage of the gross labor cost that the employee enjoys after tax. (Figure 2). This shows what in various countries is the actual tax burden on labor. (This is sometimes referred to as the tax wedge).
Figure 1 – Gross Labor Cost Multiplicator |
|||||||
| 12.000 Euro Salary | 24.000 Euro Salary | 60.000 Euro Salary | 120.000 Euro Salary | ||||
| Country | Gross Labor Cost Multiplicator | Country | Gross Labor Cost Multiplicator | Country | Gross Labor Cost Multiplicator | Country | Gross Labor Cost Multiplicator |
| Luxembourg | 0,00 | Cyprus | 1,24 | Mauritius | 1,29 | Russia | 1,29 |
| Austria | 0,00 | Mozambique | 1,26 | Chile | 1,31 | Mauritius | 1,29 |
| Mozambique | 1,15 | Mauritius | 1,29 | Russia | 1,32 | Chile | 1,44 |
| Cyprus | 1,19 | Luxembourg | 1,33 | Mozambique | 1,40 | Malta | 1,48 |
| USA | 1,24 | Malta | 1,36 | Malta | 1,42 | Mozambique | 1,49 |
| Greece | 1,27 | Chile | 1,37 | Luxembourg | 1,47 | Sudan | 1,52 |
| Malta | 1,28 | USA | 1,38 | Sudan | 1,52 | China | 1,54 |
| Mauritius | 1,29 | Russia | 1,39 | USA | 1,52 | Slovakia | 1,60 |
| Chile | 1,32 | Ireland | 1,45 | Cyprus | 1,54 | Switzerland | 1,60 |
| Indonesia | 1,34 | Sudan | 1,52 | Mexico | 1,57 | Indonesia | 1,63 |
| Ireland | 1,34 | Indonesia | 1,52 | Indonesia | 1,63 | Mexico | 1,64 |
| Finland | 1,37 | Mexico | 1,54 | Canada | 1,64 | USA | 1,65 |
| Netherlands | 1,41 | UK | 1,55 | China | 1,64 | Canada | 1,72 |
| Norway | 1,43 | Greece | 1,55 | Ireland | 1,71 | Lithuania | 1,73 |
| UK | 1,43 | Finland | 1,56 | Lithuania | 1,73 | Italy | 1,73 |
| Mexico | 1,45 | Norway | 1,56 | UK | 1,75 | Cyprus | 1,75 |
| Switzerland | 1,48 | Canada | 1,64 | Estonia | 1,77 | Luxembourg | 1,76 |
| Russia | 1,50 | Netherlands | 1,70 | Norway | 1,81 | Estonia | 1,78 |
| Sudan | 1,52 | Lithuania | 1,73 | Slovakia | 1,88 | Greece | 1,80 |
| Denmark | 1,53 | Denmark | 1,73 | Finland | 1,91 | UK | 1,85 |
| Germany | 1,56 | Austria | 1,73 | Greece | 1,94 | Czech Republic | 1,89 |
| Belgium | 1,59 | Estonia | 1,75 | Denmark | 1,94 | Ireland | 1,90 |
| Canada | 1,64 | Germany | 1,82 | Czech Republic | 1,95 | Spain | 1,91 |
| Estonia | 1,70 | Poland | 1,82 | Spain | 1,95 | Germany | 1,93 |
| Lithuania | 1,73 | Czech Republic | 1,84 | Hungary | 1,96 | Hungary | 1,96 |
| Czech Republic | 1,74 | Spain | 1,92 | Switzerland | 2,02 | Austria | 2,06 |
| Poland | 1,76 | Belgium | 1,93 | Poland | 2,06 | Norway | 2,10 |
| Portugal | 1,80 | Switzerland | 1,96 | Germany | 2,15 | Poland | 2,15 |
| France | 1,86 | Portugal | 1,96 | Austria | 2,16 | Finland | 2,22 |
| Italy | 1,88 | Hungary | 1,96 | Sweden | 2,20 | Denmark | 2,28 |
| Spain | 1,89 | China | 1,99 | Netherlands | 2,26 | France | 2,32 |
| China | 1,91 | Slovakia | 2,00 | Portugal | 2,30 | Sweden | 2,52 |
| Sweden | 1,95 | Italy | 2,03 | Italy | 2,33 | Netherlands | 2,52 |
| Hungary | 1,96 | France | 2,04 | France | 2,44 | Portugal | 2,72 |
| Slovakia | 2,00 | Sweden | 2,04 | Belgium | 2,51 | Belgium | 2,85 |
To determine what is the real tax rate on labor (payroll taxes), one must consider not only the personal income tax but also all the other statutory charges on medicine, pension and other social security benefits that are charged both from the employee and the employer (social security contributions). In this connection it is necessary to note that all kinds of social security payments, whatever they are called, are to be treated as taxes as the companies are forced to pay them by virtue of the law. We believe that this is the ultimate way of expressing the total statutory pay-roll taxes (statutory cost of labor) in a global comparison. In an economic sense it does not matter whether the charges are levied on the employee or employer, what matters is what portion at the end of the day the employee receives of all the money that is spent for the benefit of using her/his labour.
Many analysts may be fooled by the division of labor taxes into the various components and then only consider the employer’s social contributions in a comparison of labor costs. But in a real world what counts is what the employee gets as a take home pay because the salary levels will adjust to reflect the economic necessity to receive a certain net salary as a take-home income so as to meet the individual consumption needs. In an economic sense, one may consider that when social contributions on salary are charged from the employee instead of the employer that then the employee merely acts as an agent for the employer in carrying that tax burden. And the same is true for the personal income tax. The more so, in both cases, that the actual taxes are usually all over the world withheld by the employer from salaries due. It therefore follows that at the end of the analysis it is merely an accounting convention how to name the various components of payroll taxes, they are all equally taxes on labor.
We measured the tax burden on four different levels of gross salary: 1,000 euro per month (12,000 p.a.); 2,000 euro per month (24,000 p.a.); 5 thousand euro per month (60,000 p.a.); and 10,000 per month (120,000 p.a.). Due to several exemptions on the lower levels of income and tax limits on the higher end, we consider that the income levels 2 thousand and 5 thousand per month offer the best comparatives.
The net take-home salary may further be adjusted to the purchasing power parity (PPP) to get an indication of the real net earnings (from salaries and wages) in different countries. We have attempted such a calculation (Figure 3). This survey will therefore show among other things in which country an employee can make best real earnings.
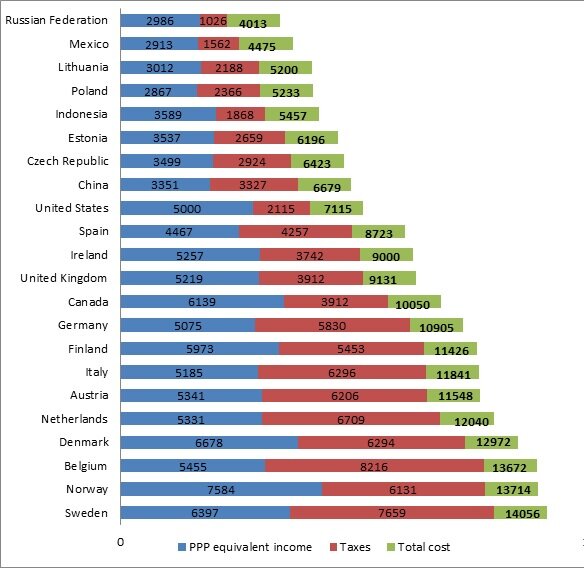
Figure 3. PPP Adjusted Tax Burden
Key findings
Our research showed that in the surveyed countries the tax on labor was the lowest in Cyprus on 24,000 euro salary level (second lowest on the 60,000 salary level).
Of the bigger countries the tax on labor was lowest in USA and Russia: USA 7th on 24,000 euro salary level and 8th on the 60,000 euro level. Russia was 8th on the salary level of 24,000 euro but surged to 3rd place on the higher income level of 60,000 euro level.
It was shown that in general the taxes on labor were the highest in the European Union countries. On the income level of 24,000 euros the worst score was received by Sweden, France and Italy, whereas on the income level of 60,000 euros Belgium scored worst preceded by France and Italy.
On an annual salary of 24,000 euros, the Gross Labor Cost Multiplicator in Russia is 1.39. This means that at this salary level, the employer’s total payroll cost is 1.39 times the net take-home income of the employee, or expressed from another point of view, the employee receives in hand 72% of all the money that the employer must pay for the employment. On an annual salary of 60,000 euros the Gross Labor Cost Multiplicator in Russia is 1.32, whereas the employee receives in hand 76 % of that money. Of the bigger developed nations only USA (Illinois) placed before Russia in the survey in the salary level of 24,000 euro per year with a multiplicator of 1.38. At the same time most European Union countries showed multiplicators from 1.5 to 2 . On the salary level of 60,000 euro per year the picture was even more favorable for Russia. Due to an increasing tax burden with higher salary levels, so-called tax progression, the multiplicator of USA had at the salary level of 60,000 euro deteriorated to 1.52, while the European Union countries (excluding some of the smaller ones with specific economic conditions) now ranged from UK’s 1.75 to Belgium’s 2.51. This means that in Russia an employee would from a gross salary of 5,000 euro per month receive a net salary of 4,350 euro and the total monthly cost for an employer would be 5,720 euro, whereas an employee in Belgium would be left with 2,670 euro from a salary of 5,000 euro whereas the total payroll cost for the employer would be 6,700 euro.
60.000 euro salary
What part of Labor Cost Goes to Tax in Different Countries
PPP adjusted tax burden
The net take-home salary may be further adjusted for the purchasing power parity (PPP), that is, to the real value of the salary in the respective home country. We have attempted such a calculation on some of the surveyed countries. (Figure 3). This is calculation is made from point of view of the total labor cost so that we determined what is the net nominal salary that will yield a PPP equivalent salary of 5,000 euros. We then further added all the taxes payable for employee and employer to yield the total labor cost. The PPP adjustment coefficient was received by comparing the nominal and PPP figures according to the World Bank’s GDP tables for year 2012.
These PPP adjusted calculations yield the best result for Russia. In Russia PPP 5,000 euro net earnings would cost the employer only 4013 euro, whereas a PPP 5,000 salary would cost the employer 14,056 in Sweden and, for example, 11,426 in Finland.
Сomparing the results with World Bank’s paying Taxes study
The failure to understand the above discussed principles of total labor taxes is particularly evident in respect to the global comparison of tax systems called Paying Taxes 2014 by the World Bank, IFC and PWC . (For reasons which remain unexplained this study which refers to data from year 2012 and was published in November 2013 is called Paying Taxes 2014).
The study forms part of the bigger project known as World Bank’s Ease of Doing Business Index. This bigger survey measures regulations affecting 11 areas of business activity, among them the regulations concerning taxation which is done in the context of the Paying Taxes survey. The tax survey attempts to measure both the compliance burden on tax administration (number of tax filings and the time it takes to perform them) and the cost of all taxes borne (the total tax rate). Unfortunately the methodology of the survey in respect to the total tax rate, and in particular concerning the total payroll taxes, is grossly inadequate as it only considers the taxes directly borne by the employer company (employer’s social security contributions) and totally ignores the payroll taxes that are relegated to be charged from the employee (personal income tax and employee’s social contributions). As a result the survey portrays a much skewed picture of the total tax burden. A case in point is Russia, which in reality as we have seen has among the lowest payroll taxes in the world, has been awarded a dismal ranking in the indicator of total tax rate. Russia is in the methodology of World Bank placed 178th out of 189 countries on this parameter. According to these misguided criteria taxes in Russia is supposed to take 50.7 of the profit placing Russia 143rd in the rating.
To show how misguided an effort it is, as the World Bank does, to rank the tax burden solely by the criteria of what is the direct employer’s social contributions we may look at the global comparison tables that show what are the personal income tax rates and what is the share of the employee’s social contributions of the total labor taxes.
The World Bank survey contains several other flaws, not only is its theoretical framework wrong but wrong are also the actual methodology and the assumptions that the survey is based on. The point is that the World Bank with PWC has not in fact studied any real data and instead bases its survey on what would in a fictive world be the fictitious taxation of a hypothetical company.
They determine certain parameters for this fictive company and then ask representatives of various countries to opine what would be the tax burden if such a company under such and such assumptions would operate in the given country. The business of this hypothetical company is defined as the production of ceramic flowerpots which it sells at retail. At the same time it is set that the company operates in the economy’s largest business city, which in the case of Russia would be Moscow, or in case of UK – London, in Sweden – Stockholm. Thus to start with the premises of the survey are totally flawed. It is a very unreasonable assumption that such kind of busi- ness would be conducted in these kinds of European metropolises. There is also an assumption that the model company would employee the same amount of management and staff in each country, namely: 4 managers, 8 assistants, and 48 workers. There then is the question of how to define the salaries of the employees. This has in the fictitious survey been resolved by determining that the managers receive an annual salary defined as ‘2.25*income per capita’, the assistants ‘1,25* income per capita,’ and workers ‘1*income per capita.’ By ‘income per capita’ the World Bank apparently refers to GDP per capita. But it is a strange as- sumption to determine salaries in such a way. GDP has very little, if anything, to do with salaries. It is even more strange that for this survey which refers to data of year 2012 (and is called the 2014 sur- vey) uses the GDP data of year 2005 to determine the fictive salaries for year 2012. The GDP per capita for Russia in year 2012 was 14,037 according to the proper World Bank, but in the survey they used the 2005 figure of 5,337 USD, thus completely distorting any possibility to a real comparison.
The problem with these totally unrealistic assumptions are that in various countries the rates of taxes and total tax burden are different for different levels of income. Thus when the survey defines the salaries at a completely unrealistically low level then the tax burden is not properly expressed. It was already mentioned above that the theoretical framework of the World Bank study was wrong to start with as it, while purporting to give the “total labor tax rates,” solely included the employer’s social contribution in the calculations and excluded the employee’s social contributions and personal income tax which make up the majority of labor taxes. As Russia has low personal income taxes and no employee’s social contributions this already places Russia at a disadvantage. But then the survey introduced another flaw by the series of blatantly wrong assumptions about the salary levels. As Russia applies a regressive scale on employer’s social contributions, this resulted in the labor tax on that parameter seeming much higher than it in reality is. Using realistic salary assumptions (provided by Awara Direct Search recruitment agency), the total salary costs for the given positions would be 665 thousand US dollars, that is, more than double the salaries given for the survey, which was 304 thousand USD. This more realistic salary level in turn would yield 18.6% as the total level of labor taxes (by the flawed method of only considering the employer’s social contributions), whereas the wrong assumptions yielded 32.5%, again almost the double of what more fair calculations would have yielded.
We have not attempted to analyze how the figures of the other taxes of the survey were actually arrived at, but given these apparent flaws in the labor taxes we may assume distortions in regards to them, too. It therefore seems to me that instead of attempting such a quasiscientific survey, the World Bank should measure the tax burden not in relation to such a model company fraught with such numbers of defects in underlying assumptions and instead calculate the tax burden as we have done it in the Awara Global Survey of Total Payroll Taxes, that is, by directly analyzing the applicable tax laws to a given level of salary.
Notes on method
The data for the survey has been mainly derived by way of asking experts from the respective countries to furnish it. The data refers mainly to year 2012 but may in some cases also refer to 2013. The data furnished by the experts have been verified against from other sources. We may refer mainly to these sources:
- Worldwide Personal Tax Guide 2012 by EY
- Worldwide Personal Tax Guide 2013-2014 by EY
- KPMG Individual Income Tax and Social Security Rate Survey 2012
- KPMG Individual Income Tax and Social Security Rate Survey 2013
In many of the countries that tax rates and principles vary between regional entities, for example, states, counties, cities, municipali- ties. Therefore, the survey refers to the capital city of each country, except for these cases:
- Canada refers to British Columbia
- USA refers to Illinois
- Switzerland – Zurich
- Italy – Lombardia
We have considered:
- taxes on all salaries, wages and similar remuneration
- employer’s statutory social contributions (statutory plan costs) on pension, unemployment, medical plan or workplace injury insurance, or other similar plan or tax payments
- statutory social contributions charged from the employee
- personal income tax and other wage-based taxes charged on all levels of government (Federal, state, county, municipal, e, applicable to the relevant country)
We have not considered individual tax deductions that a person can make from his taxable income and we have not considered the tax benefits that are in some countries awarded to couples and families, and any similar differences in taxation.
We stress that the survey considers the statutory labour costs and thus does not include voluntarily benefits that the employer spends on payroll. (Non-statutory (voluntary) labor costs which are not directly based on a legal requirement). Arguably it is not always feasible to draw a clear line between statutory and voluntary costs as the voluntary costs may in some jurisdiction be deemed as costs that are beyond the discretionary powers of an employer. This could be, for example, a 13th monthly salary applicable in some countries or health care. For example, in the US, employers cover significant non-statutory costs for private medical insurance which are not considered in our survey.
Compensations for vacation (holidays) and sick leave have not been considered.
We acknowledge that there may be some inaccuracies concerning the exact data for a given country but we believe that this cannot have any significant effects on the grand picture.
We have included the countries in the survey based on the ready availability of experts to furnish us with data. We thank the below listed firms that have assisted us. But we note that none of the listed firms bare any liability for the accuracy of the data because the method of cross-referencing the data may have caused us to change a bit the data furnished by the expert firms.
|
EUROPE |
|||
| Belgium | Dumon, Sablon & Vanheeswijck | Brussels | http://www.dsvlaw.be |
| Portugal | Carvalho, Matias & Associados | Lisbon | http://www.cmasa.pt/ |
| Italy | CBA Studio Legale e Tributario | Milano | www.cbalex.com |
| Hungary | Bihary, Balassa & Partner | Budapest | http://www.biharybalassa.hu/ |
| Malta | EMD | Valletta | www.emd.com.mt |
| Ireland | Kane Tuohy | Dublin | www.kanetuohy.ie |
| Sweden | Hökerberg & Söderqvist Advokatbyrå KB | Stockholm | http://www.hsa.se/ |
| France | Campbell, Philippart, Laigo & Associes, SELARL Law Firm | Paris | www.parislaw.tm.fr |
| Norway | Advokatfirmaet Sverdrup DA | Oslo | http://www.sverdruplaw.no/ |
| Denmark | Lund Elmer Sandager | Copenhagen | www.lundelmersandager.dk |
| Spain | Adarve Abogados SLP | Madrid | http://www.adarve.com/ |
| Cyprus | KPMG Limited | Nicosia | http://www.kpmgcy.tv/ |
| Poland | Kalwas & Partners | Warsaw | http://www.kalwas.pl |
| Netherlands | Dirkzwager Advocaten & Notarissen | Arnhem | http://www.dirkzwager.nl/ |
| Greece | A&K Metaxopoulos and Partners | Athens | http://www.metaxopouloslaw.gr/ |
| Finland | Lexia | Helsinki | http://lexia.fi/ |
| Switzerland | Swissotel Krasnye Holmy | Moscow | www.swissotel.com/moscow |
| Luxembourg | Tabery & Wauthier | Luxembourg | http://www.tabery.eu/ |
| Slovakia | Eastfield | Moscow | www.eastfield.sk |
| Lithuania | Lextal | Vilnius | www.lextal.lt |
| Czech Republic | Vyskocil, Kroslak a spol. | Prague | www.akvk.cz |
| Germany | Alpers & Stenger | Hamburg | http://www.stengerllp.de/ |
| Estonia | Lextal | Vilnius | www.lextal.ee |
| Austria | WKO Österreichisches AußenwirtschaftsCenter Moskau (Advantage Austria) | Moscow | wko.at/aussenwirtschaft/ru |
|
NORTH AMERICA |
|||
| USA | MIT Skoltech Initiative | Cambridge Massachusetts | web.mit.edu/ |
| USA | American Institute of Business and Economics | Moscow | http://www.aibec.org/ |
|
SOUTH AMERICA |
|||
| Mexico | Pro Mexico Trade and Investment | Frankfurt am Main/Moscow | www.promexico.gob.mx |
|
AFRICA |
|||
| Sudan | Omer Ali Law Firm | Khartoum | www.omeralilawfirm.com |
| Mozambique | Fernanda Lopes Advogados | Maputo | www.fla.co.mz |
| Mauritius | BLC Chambers | Port Louis | www.blc.mu |
|
ASIA |
|||
| China | HIL International Lawyers & Advisers | Beijing, Shanghai | http://www.hil-law.com/ |
| Macau | Legal Macau Lawyers | Macau | http://www.legalmacau.com/ |
| Indonesia | Embassy of the Republic of Indonesia Moscow | Moscow | http://web.archive.org/web/20080616130458/ http://kbrimoskow.org/embassy.html |
You can also watch a PDF version of the research in the window below.
Awara
Accounting services in Russia

Would you like to share your thoughts?
Your email address will not be published. Required fields are marked *
0 Comments